| Ratings | 9,999,994 |
| Users | 69,877 |
| Items | 10,676 |
| Density | 1.340% |
| Item Gini | 0.805 |
| Start Date | 1995-01-09 11:46:49 |
| End Date | 2009-01-05 05:02:16 |
Data Description
Rating Statistics
Item Statistics
This section describes the distribution of various item statistics from the data set.
Item Popularity
What is the distribution of popularity?

Let’s also look at this as a Lorenz curve, for clarity:

Item Average Rating
What is the distribution of average ratings?

User Statistics
We now turn to the distribution of various user statistics.
User Average Ratings
How are user averages distributed?

User Activity Level
And what is the distribution of user activity levels (# of ratings)?

Ratings over Time
The MovieLens ratings have timestamps, so we’ll also look at a temporal view of the data.
Data Volume
How did the data grow over time?

How many ratings are we getting each month through the life of the data set?

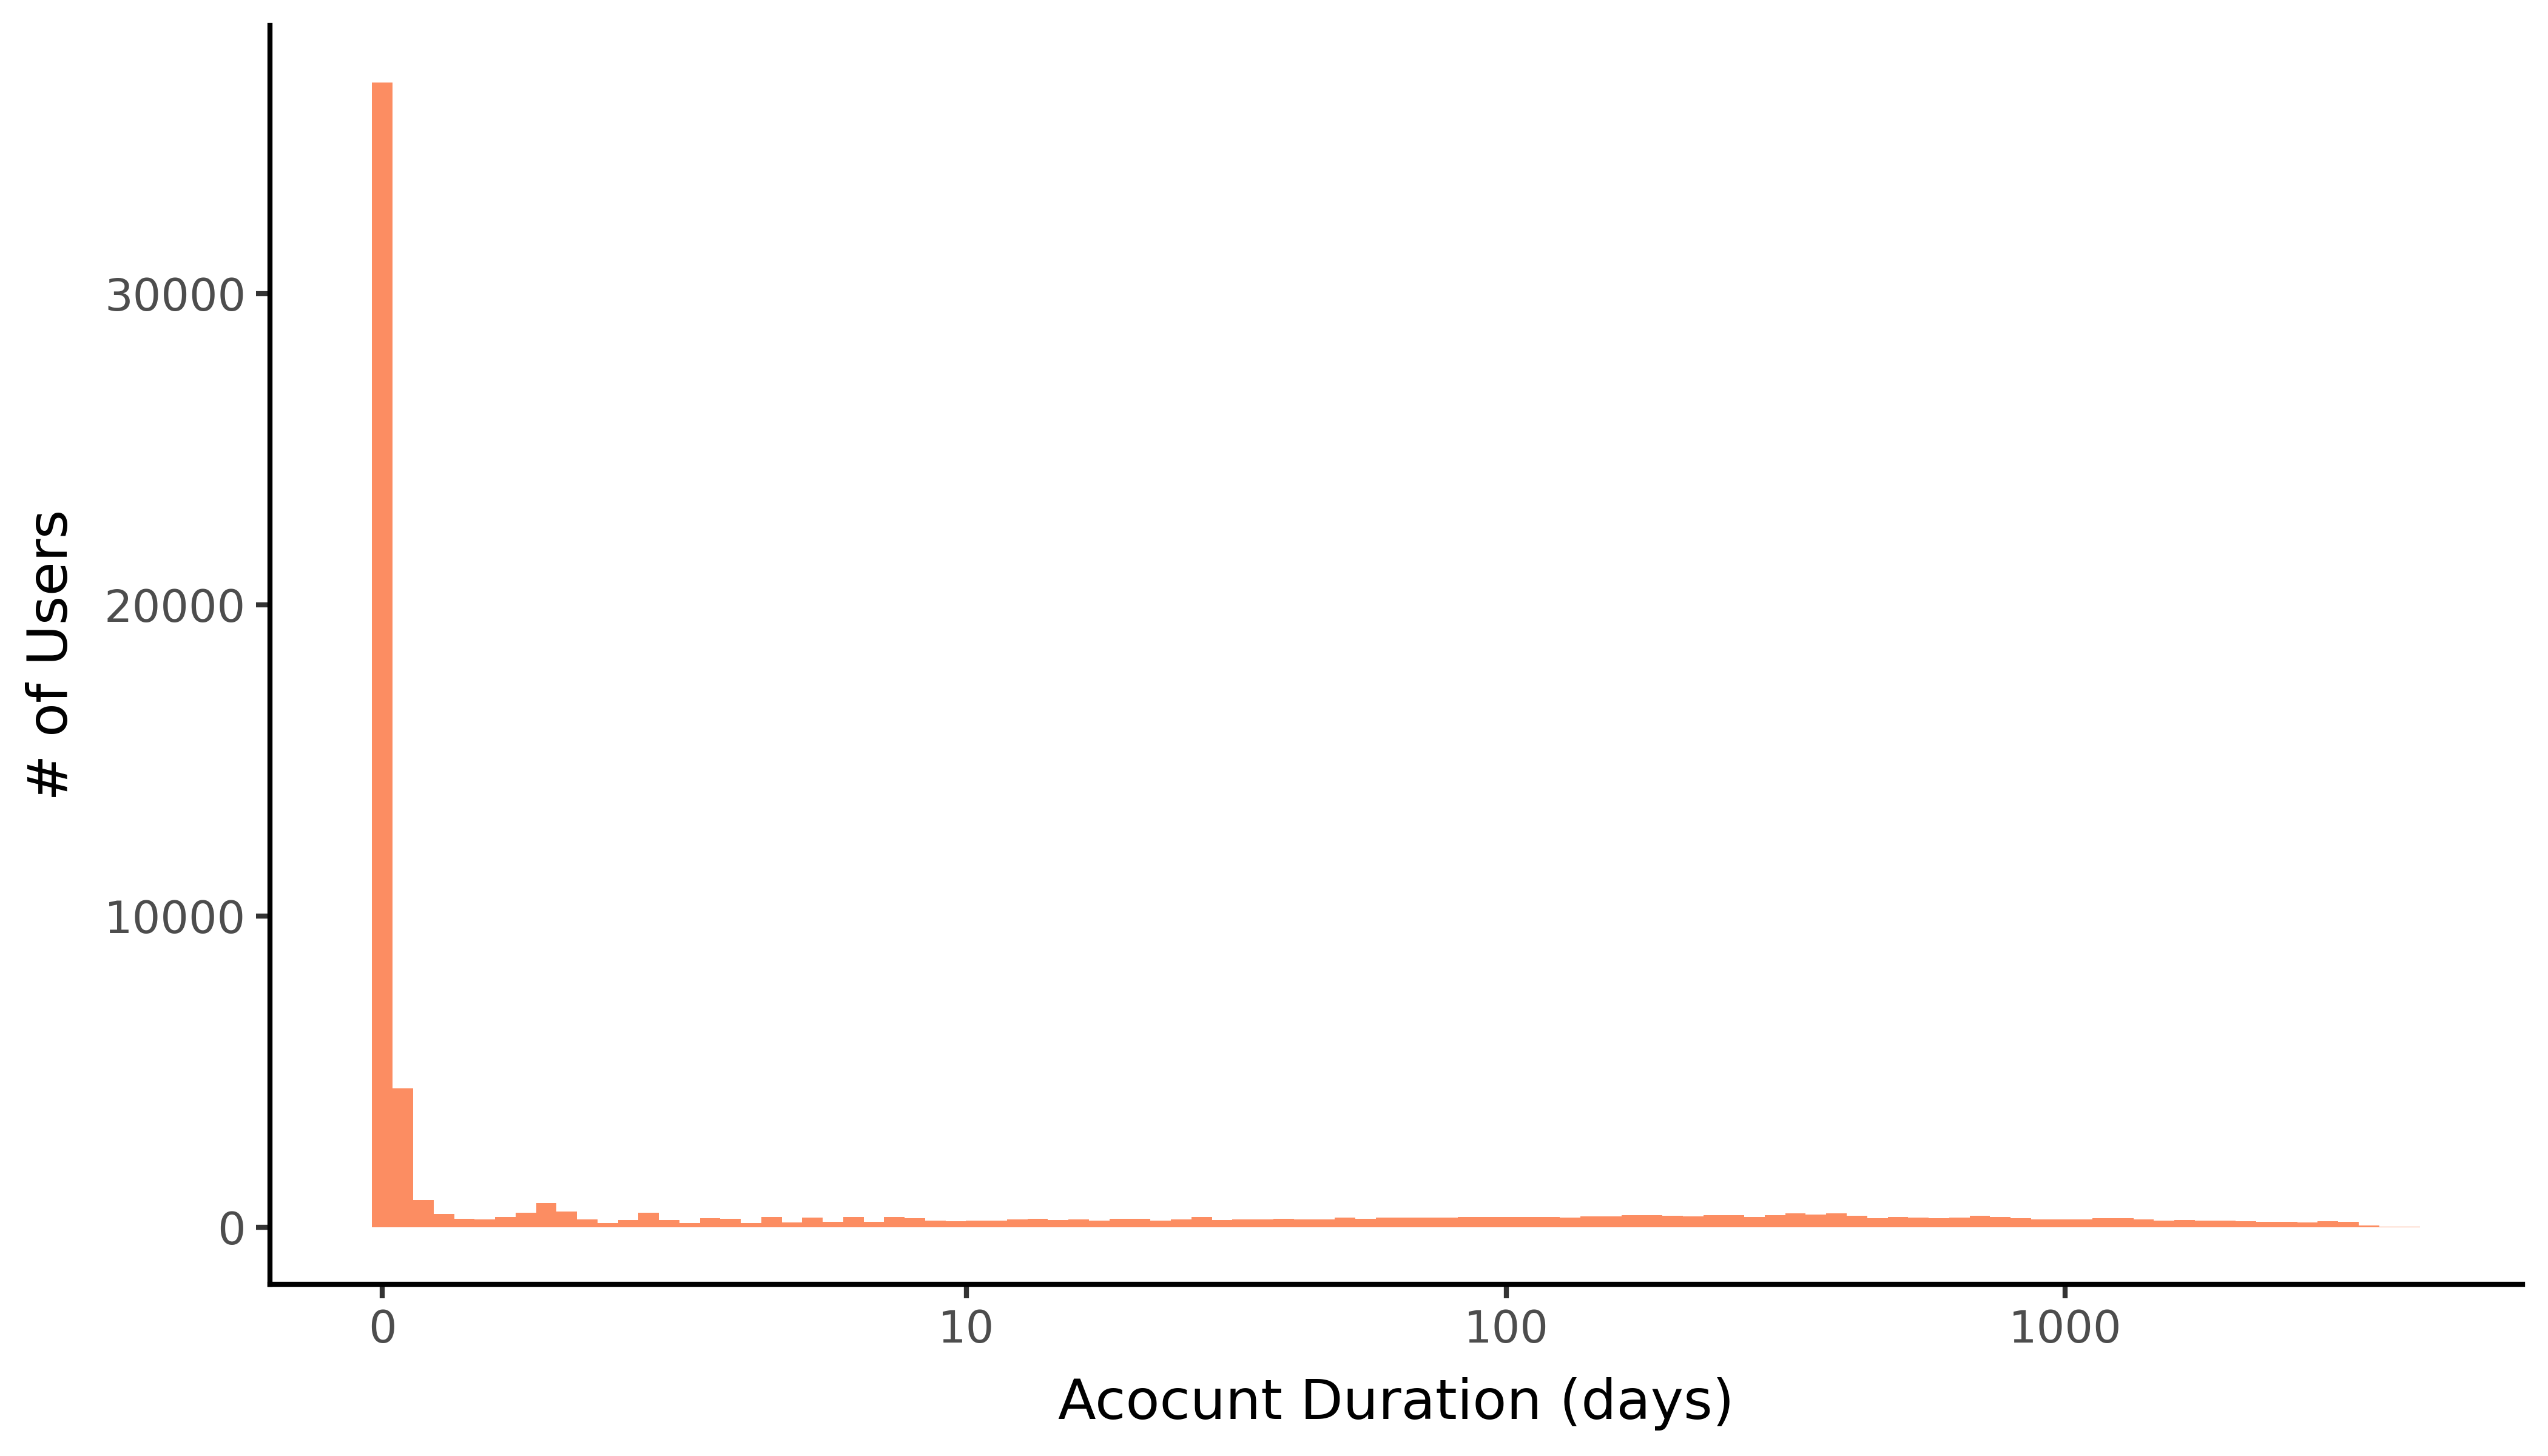
User Activity
Monthly unique users is a good measure of user activity.

How long do users usually stick around?

Parametric Activity Distributions
Some downstream uses benefit from parametric distributions of user/item activity levels.
Item Activity Distributions
This section models the item popularity distribution with various parametric distributions.
| Distribution | Params | Location | Scale | D(KL) | Δ(JS) |
|---|---|---|---|---|---|
| Log-normal | s=2.121 |
0.711 | 140.047 | 0.366 | 0.284 |
| Pareto | b=0.199 |
0.001 | 0.998 | 0.844 | 0.403 |
| Power law | a=4.023 |
0.66 | 999.762 | inf | 0.714 |
| Geometric | p=0.001 |
0 | 1.093 | 0.439 |
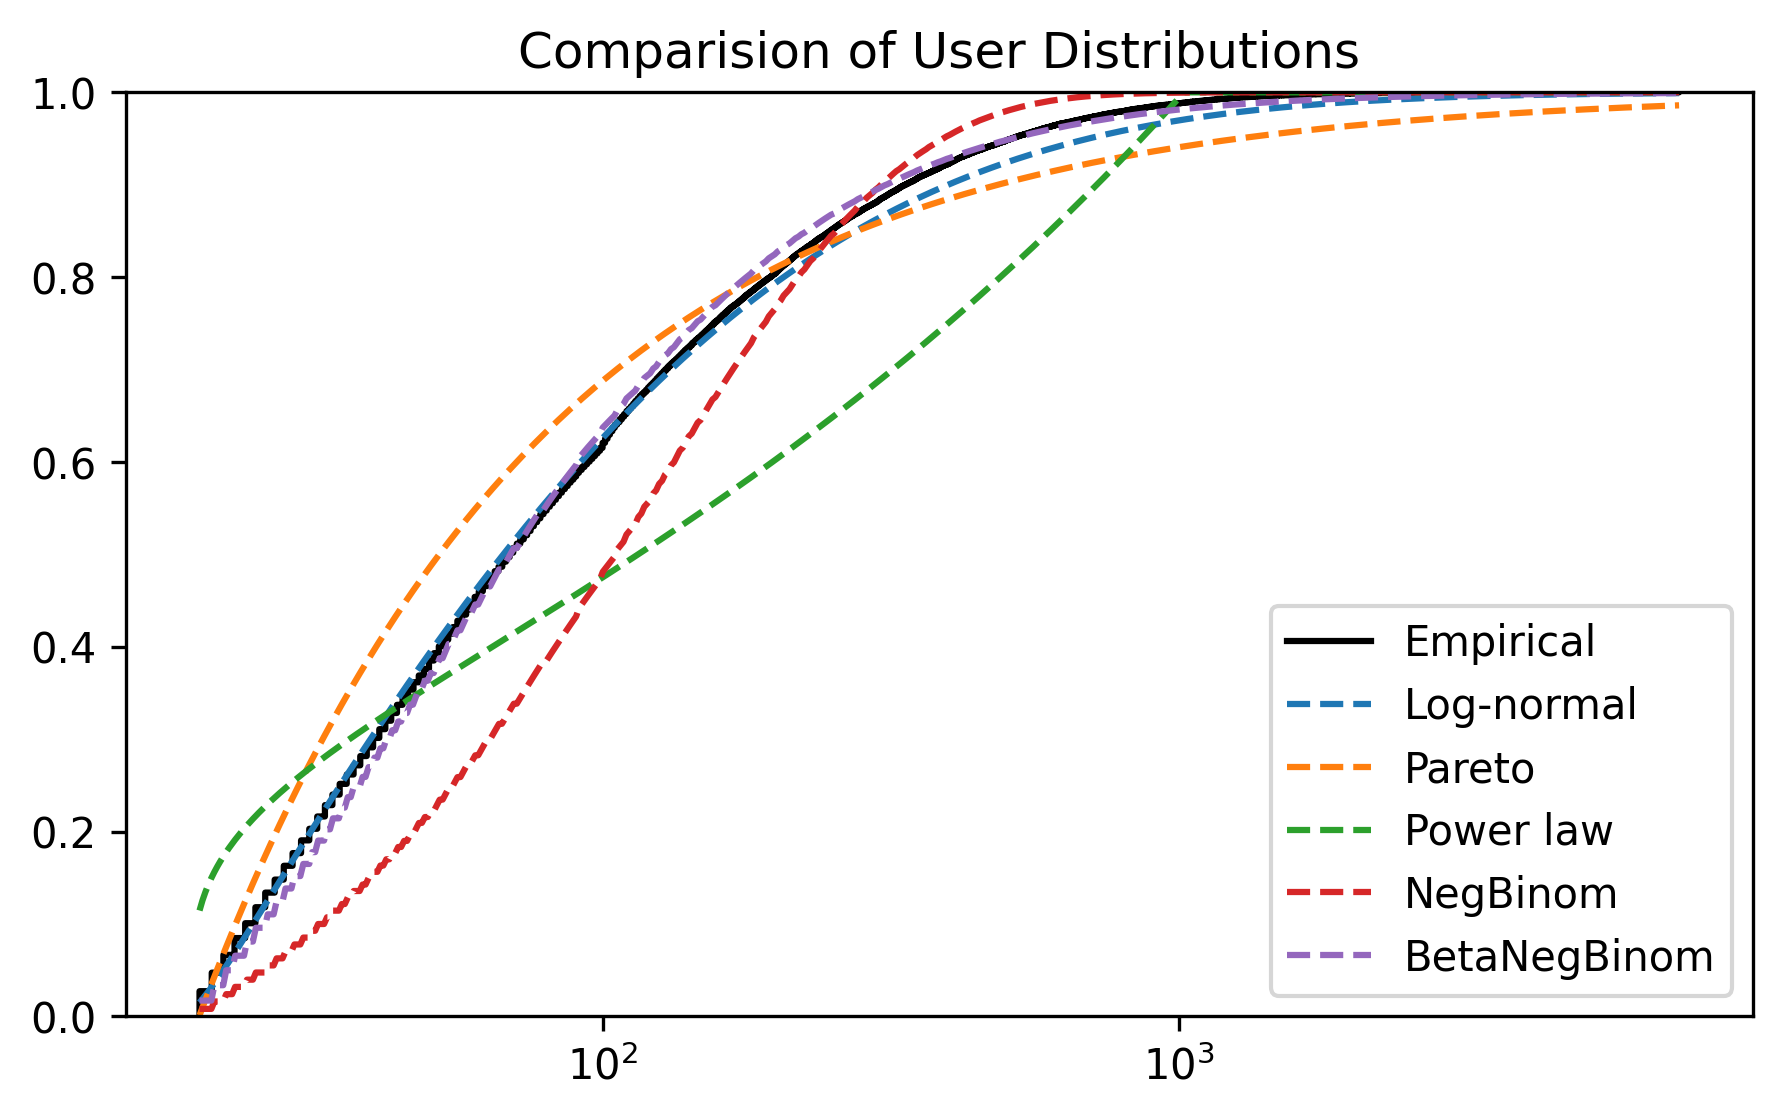
User Activity Distributions
Now the same, for user activity distributions.
| Distribution | Params | Location | Scale | D(KL) | Δ(JS) |
|---|---|---|---|---|---|
| Log-normal | s=1.517 |
18.472 | 51.355 | 0.044 | 0.103 |
| Pareto | b=0.790 |
0.102 | 19.879 | 0.114 | 0.167 |
| Power law | a=0.377 |
19.983 | 999.838 | inf | 0.293 |
| NegBinom | n=1.000, p=0.008 |
20 | 0.185 | 0.182 | |
| BetaNegBinom | n=1.000, a=1.630, b=93.430 |
20 | 0.033 | 0.094 |